A week or so ago I wrote three-quarters of a blog post about this, inspired by the attention that my Africa tile map viz was getting. I ran out of time and “parked it”, heading off to the Tableau Conference in London
To summarise my first (unpublished) post: I compared a data visualiser publishing her personal work online to a (traditional) artist displaying her work at a gallery. An data visualiser’s collection of work on his blog, website or Tableau Public profile is like an artist’s portfolio. I was pretty sure I had a good analogy going, but that’s what it was, an analogy. And it was an analogy that meant i was prepared to admit that yes, I do publish visualisations for attention, and this contextualised it nicely for me.
The portfolio analogy of the online data visualiser was a simple and obvious one, but a key one that bears repeating. I’ve often felt that a varied and eye-catching portfolio of visualisation work is a huge help when seen as just that – I know of several people whose portfolio, in Tableau Public or otherwise, has actively helped in the process of getting a job (myself included).
But, as I say, I didn’t quite finish that or draw it to a reasonable conclusion. I went to the conference last week, where in the “Box and Whisker Bistro” (one of the many themed rooms in the venue) I saw this:


It’s worth saying, that at my age (and those with a keen eye and an accurate abacus can work out exactly what that is from above), things can come as a surprise even when you’ve had strong hints dropped about them in advance – I remembered there may be such a display, but had subsequently totally forgotten. It’s great – I can watch my favourite films over and again and still not know what happens! Anyway, back to the blog …
So what’s this? It’s a real actual art gallery (for the duration of the conference). With actual art works. And they picked mine, not once but twice. Now, I’ve always loved the idea that for more creative visualisations on the David McCandless side of the spectrum (look away, Stephen Few and advocates) would be great if framed, blown up in size to large installations, and shown as artworks, but I’ve never seen it done. And it’s fair to say, I bloody loved it.
And they’ve even put biographies for each picture (shame about the date of birth) to make it look like I’m an actual proper artist. A nice touch!
Here’s a photo I took of Tableau’s Andy Cotgreave (there were whispers that he’s written a book recently that might be very good – the Big Book of Dashboards and Charlie Hutcheson – a great friend in the community who has quite possibly the best blog for those learning Tableau. Not only does Andy have a great current book, but I believe he was instrumental in the gallery idea. How many chances will there be to meet them both at the same time and get great photographic proof? But instead I shoved them off to the side so I could sneak in a photo of my pictures in situ in the gallery with people looking at them …

So now before I meander onto the rest of the post I should give some context and a big thank you to Tableau. The context: I’m a non-artist. A non-drawer. My artistic talent is off the scale in a minus direction. I came from a school where we had to submit sketches to our art teacher which would be graded 5 points for an A, 3 for a B and 1 for a C. Lowest scores got shamed and put in a league of shame on the wall, with potential detention for those not meeting a certain threshold. (Different times!). My sketches got ticks. An acknowledgement that they were done and submitted, but saved from the embarrassment of a mark lower than C. Not saved from the embarrassment of a place in the hall of shame on the wall though. So that’s some context having been through school last century as “boy least likely ever to get work shown in an art gallery in his life”. So it’s in that context that I sincerely thank Tableau for doing this – it made this middle-aged artistic klutz taking up a new career in data visualisation / data art very happy and proud of his achievements – an unexpected career highlight for which I thank you sincerely!
My pieces were just two out of eleven and I’m honoured to be in the company of the remaining works, see them here:


The remaining artists are Rody Zakovich, Chris Love, Matt Francis, Pooja Gandhi, Rob Radburn, Adam McCann, Mike Cisneros, Ben Davis, Many of whom I have previously cited as my influences, and the rest of whom I look up just as much. Thanks to the biographies, I know there’s a certain irony in the fact that I always look to Rody for inspiration (code for I quite often steal his work, like an artist of course), yet he is a depressing eighteen years younger than me!
So, apart from this being a wonderful ego-boosting surprise example of an analogy taking form in reality, have we answered the original question? My thoughts about publishing data visualisations for attention were obviously more leaning towards publishing (and publicising) online visualisations for all to see – whether on social media, blog posts or areas such as Tableau Public.
There’s a feeling that people are using things like Makeover Monday to make a name for themselves. Or that people are courting attention from new or highly technical visualisation types. Those of us who are not professional data journalists or visualisers (perhaps, like me, they will use tools such as Tableau professionally, but not to produce the kind of work that they will publish publicly) will produce a visualisation, but what then? Do we just keep it to ourselves, or do we publish it and publicise it with a tweet or a posting?
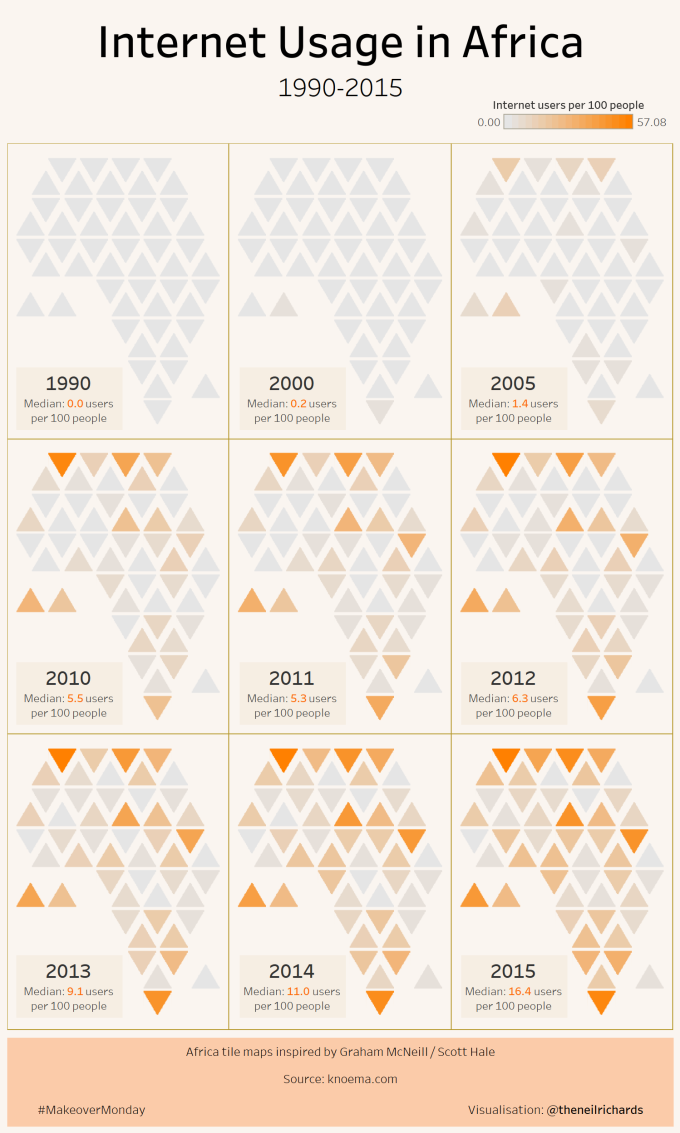
I agree, that’s what people do. I know this, because I do it. For me, Makeover Monday is a great yardstick. Last week, I published my Africa tile map visualisation. And, with no great subtlety, because it’s one I’m really pleased with, I’m going to show it again here.
Because work published for MakeoverMonday gets published at roughly the same time each week, to the same group of Twitter followers, I know that certain works are getting more attention than others. And whether we court it or not, (positive) attention is the sign of a visualisation that has worked well. I make no apologies for excitedly watching and counting the number of likes and retweets it garnered through the week, because I could draw an obvious conclusion from it: that was a good one, people liked it.
Week 22: Internet Usage in Africa: 125 likes, 28 retweets
Week 21: Drinking Habits of Britons: 12 likes, 0 retweets
Week 20: Youth Employment in Latin America: 27 likes, 0 retweets
Week 19: Car Colours in the Netherlands (seen above, which I’m not sure if I’ve even included in this blog before, and therefore shown below): 44 likes, 3 retweets
Week 18: Sydney Ferries: 23 likes, 1 retweet

And so on … whereas it’s not a matter of pimping likes and retweets, the reaction of a visualisation in the public arena is as good an indication as any that we have of how well received our work is. I can look at the above, and see that my week 21 submission was largely overlooked. OK – I have to squint through the numbers and it would be much clearer if I visualised it, but you get the point. Week 20 was also somewhat down on my usual figures. I don’t see it as being competitive, but rather see the quantity of interactions as a critique on my work. Weeks 20/21 , could do better. Week 22, you nailed it – you did something good, or at the very least did something that got liked and noticed.
I don’t see it as desperately looking out for likes/retweets and attention from a numbers point of view. I don’t expect anything to “go viral” – I’ve never put anything on reddit and wouldn’t want to. I follow my reactions enough to know that 125 likes for Africa tile maps is my best ever, but I’m fully aware that in the grand scheme of things that’s not exactly a sensation, nor is it likely to get me included in the next Olympics’ opening ceremony. My cousin’s dog, Sprocket, got national media coverage and 3000 likes in a day, and rightly so. He’s the standout picture in this blog post!

The “work/out of work” dilemma is a difficult one – many people use visualisations and hone their skills in a certain direction while using software at work, but often to a corporate standard or a very closed skillset. Publishing “non work” visualisations can take any form – do you hone these skills further to create corporate style dashboards on a variety of open datasets, or utilise your hidden graphic skills to create a work of beauty? But for anyone who does so, who is their audience?
Chris Love wrote here (and he’s not the only one) about the difficulties of finding an audience for personal projects. A new, ground-breaking or artistic piece of work will tend to be published only to your professional or social media bubble. We create visualisations considering the number one rule “know your audience” but for non-client dashboards you can’t determine your audience. I could create a piece all about golf, or pop music, or the Oscars (all of which I have done) but my audience, by definition is not specific to any of those areas. Rather it is those who have chosen to follow me on social media outlets, for whatever reason that might be. So it’s easy to see the frustration, or the futility even, of just releasing work to an undefined audience, with the only measure of reaction or appreciation being in the likes/retweets or equivalent reaction. So sometimes, unless we have a different “way in”, that’s our only option for “non work” pieces. But I don’t think that’s something to shy away from, or deny that it’s what we do.
At the conference, I was asked to give an interview for the Tableau Wannabe podcast. I was delighted to say yes (after all, this is a post loosely related to the humblebrag and pimping for self-promotion, so in for a penny …!) just to give my perspective, and I found to my surprise, that as someone who doesn’t usually say much, that give me a data visualisation topic and I can waffle for England!
I do believe though that if data visualisation is both your hobby and your profession, then the public forum is the ideal outlet for what you create. One of the things that I mentioned, which I have had the most feedback on since doing the podcast last week, was about working on personal projects and working with data you love. It’s already inspired some work such as this by Sarah Bartlett (or, if it hasn’t, and they were going to do it anyway, they’ve been kind enough to credit me). And I think it’s important to work on personal projects, enjoy yourself, learn your skills as you’re doing them, and get them out there! If that counts as visualising for attention, by soliciting reaction, feedback and “likes” then count me in.
Perhaps because I still think of myself as being very much on the steep, early, upward phase of my learning curve, I see no shame in this. We’re lucky to have a thriving online data visualisation community who help fellow participants to develop. And if any of those and my fellow friends in the community are reading this blog post and enjoying it, then I ask ashamedly, feel free to like and retweet the link!

Couldn’t agree more. Thanks for sharing, Neil. There’s nothing wrong with putting something you’ve created and that you’re passionate about in the public eye, however extensive that might turn out to be. I just had to remind myself at the very beginning to be open to both praise and criticism, and to accept that even some ridicule may come from those I who don’t know me or what I’m trying to do. With that little self-delivered pep talk, the rewards, the growth and the connections I’ve made have been life-changing.
LikeLiked by 2 people
“Do we publish Data Visualisations just for attention” – this is an interest blog post Neil and one I’ve read a number of times to work out how I want to comment. Outing yourself as being “in the game” for RTs and Likes is a brave move and I agree with a lot of what’s written here so let me lay out my thoughts below:
Do we publish Data Visualisations *just* for attention? (emphasis mine). I notice two things about your post. Firstly, you make no attempt to provide any other reason for posting a visualisation other than for attention during your post. Secondly you added the word *just* to the title adding further emphasis on the fact this is the only reason for publishing.
For me the reason we publish a visualisation is to inform and educate an audience, secondary but equally as important is providing engagement for the viewer to ensure they take the time to view and understand a visualisation. Any “attention” should be a positive side effect of the audience appreciating and rewarding that process through sharing and favouriting the result.
So I wonder how much Makeover Monday skews the approach here. A Makeover Monday data viz is conceived in a slightly different way to most data visualisation. Here the audience can be assumed to already be informed on the subject (given your followers are likely to be other Makeover Monday participants) and they are likely to be already engaged enough to want to understand the visualisation given they have an inherent interest.
Given a pre-informed and pre-engaged audience the twitter RTs and likes will not likely “reward” anyone who doesn’t stand out from the crowd. And so instead they reward, and encourage, uniqueness among the community. As the community grows so does this race for being the “most different”. Does the resulting attention mean one is rewarded for having a “good” data visualisation – well it depends on the definition of good – but one can understand how good data visualisations may be lost and unrewarded by attention in the process.
So perhaps your post should be entitled: “Do we publish Makeover Monday Data Visualisations just for attention?”
If we do is this a bad thing? No.
So should change their approach, the skills learnt through novel experimentation are huge, and the feedback as to what works and what doesn’t is invaluable as part of the learning process. Secondly the “buzz” of seeing your notifications light up is a great way to stay engaged with a fun hobby.
Though I would encourage participants not to indulge in hubris around the merits of their data visualisations from Twitter feedback or Makeover Monday feedback as a whole. While I know you personally keep your feet on the ground, thanks in no small part to Sprocket, it is easy for those new to Data visualisation to forget that our world is a very small part of a very small part of a field which has been in place for hundreds of years. I fear it’s inevitable our efforts, no matter how important to us, will be confined to the twitter archives after our 15 minutes of “fame”.
And, not wanting to end on that horribly negative note, I’ll just say keep on posting and having fun! I enjoy seeing your data visualisations and watching your journey develop.
LikeLiked by 1 person